Important facts about nonprofits and mail–May 5, 2016
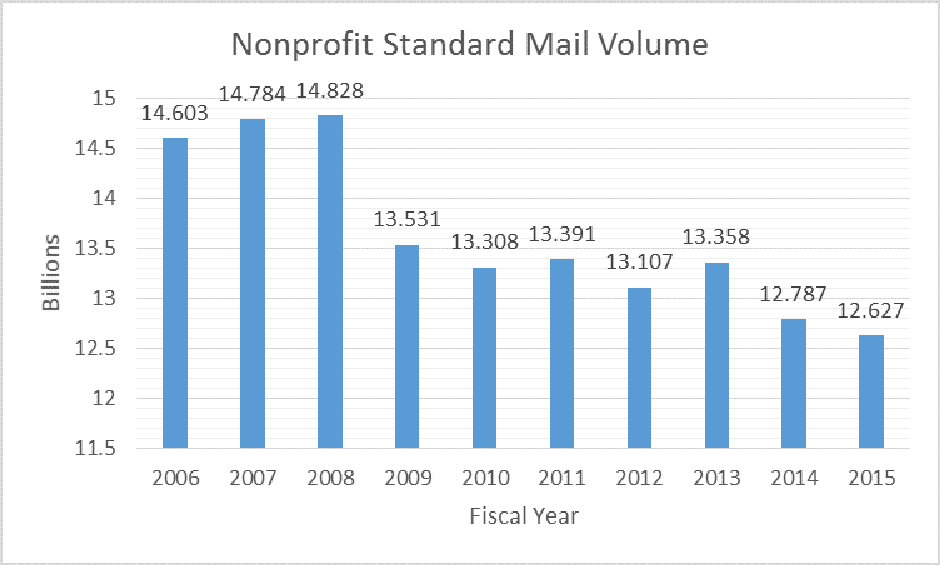
- Nonprofits generate one in ten pieces of mail delivered by the United States Postal Service. In 2015, that included 12.6 billion pieces of Nonprofit Standard Mail, 1.4 billion pieces of Nonprofit Periodicals, and over 1 billion pieces of First Class Mail primarily used to send donations to nonprofits. Total USPS volume in 2015 was 154 billion.
- Many nonprofits rely on postal mail as their main, if not only, source of funding. For many nonprofits, most of their revenue comes through First Class Mail.
- While some like to say that there is competition for everything the USPS does, the reality for nonprofits is that they cannot replace postal mail. Most nonprofits are captive customers of USPS. They put every supply and service out for bid, except the delivery of mail and publications. Nonprofits use digital alternatives to mail but they are not scalable or nearly as effective as postal mail. Digital media are an adjunct to mail rather than a direct alternative or replacement.
- The nonprofit, government-owned USPS needs to retain a broad diversity of content in the mail to continue to thrive. USPS chief marketing and sales officer Jim Cochrane has said that his goal is to fill the mailbox, and he is right. American mailboxes need to be filled with a diversity of things that households want to receive, read, and act on. For many of us, the nonprofits we support fit that bill.
- Nonprofits’ use of mail does react directly to the cost of postage. For the two years the recent 4.3 percent pricing surcharge was in effect, Nonprofit Standard Mail volume dropped 4.7 percent compared to the previous five years. We expect some rebound with the removal of the surcharge as many of our members have said they will use the postage differential to help pay for more fundraising.
- Large nonprofit mailers of magazines and newsletters can trace the majority of their contributions to subscribers to their publications.
The National Philanthropic Trust reports many charitable giving statistics including the following:
- Charitable giving in the U.S. reached $358.38 billion in 2014.
- The average annual household contribution is $2,974.
- In 2014, the largest source of charitable giving came from individuals at $258.51 billion, or 72 percent of total giving.
- Charitable giving accounted for 2.1 percent of gross domestic product in 2014.
- It is estimated total charitable contributions will total between $21.2 and $55.4 trillion from 1998 through 2052.
- In 2013, online giving grew by 13.5 percent, while overall charitable giving grew by 4.9 percent.
- Of all charitable giving in 2013, online giving accounted for 6.4 percent.
- Small nonprofits grew their online giving the most.
Leave a Reply